How to Use Python to Track Monthly Trends in Sales, HR, or Finance Data
Start with clean monthly data, or your trend report will lie to you If you want reliable monthly trends in Python, the first job is boring and completely non-negotiable:…
Home/Reporting and Visualization
4 articles
Start with clean monthly data, or your trend report will lie to you If you want reliable monthly trends in Python, the first job is boring and completely non-negotiable:…
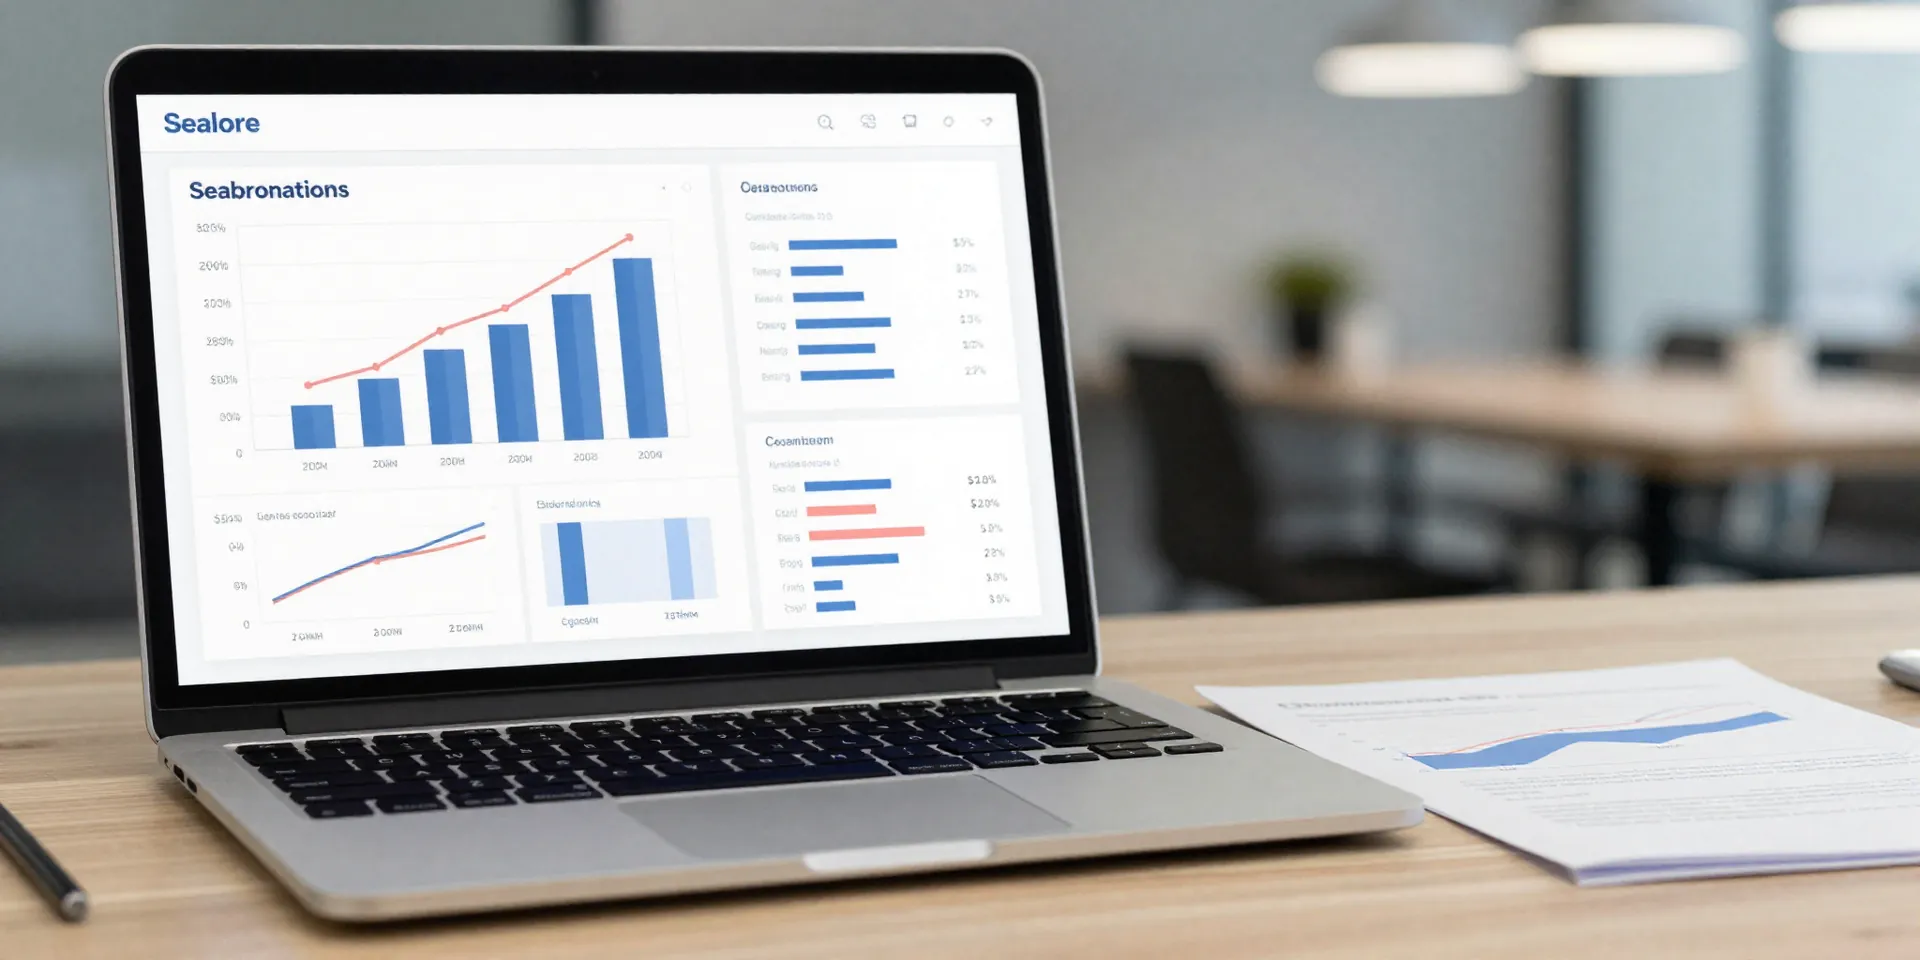
Start with bar plots and count plots when you need an answer fast If you are looking for seaborn plots beginner users can trust right away, start here. A bar plot is the…
Start With a Small, Messy Dataset You Can Actually Finish If you want to go from raw data to dashboard without getting lost, pick a dataset that is boring in the best pos…
Pull data from five messy sources without touching a single spreadsheet tab If you want to automate reporting tasks before the week starts, this is where the real time sa…